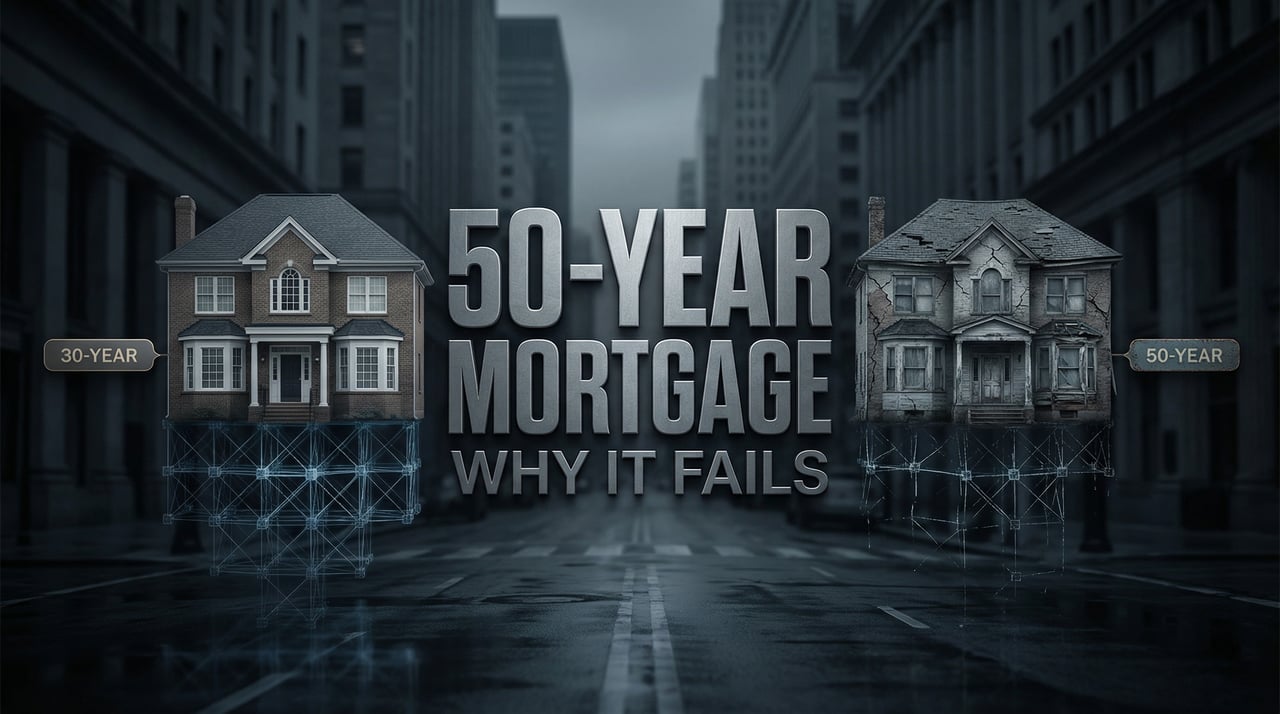
The 50-Year Mortgage vs. the 30-Year Mortgage
A Real Cost, Real Equity, Real Investment Analysis
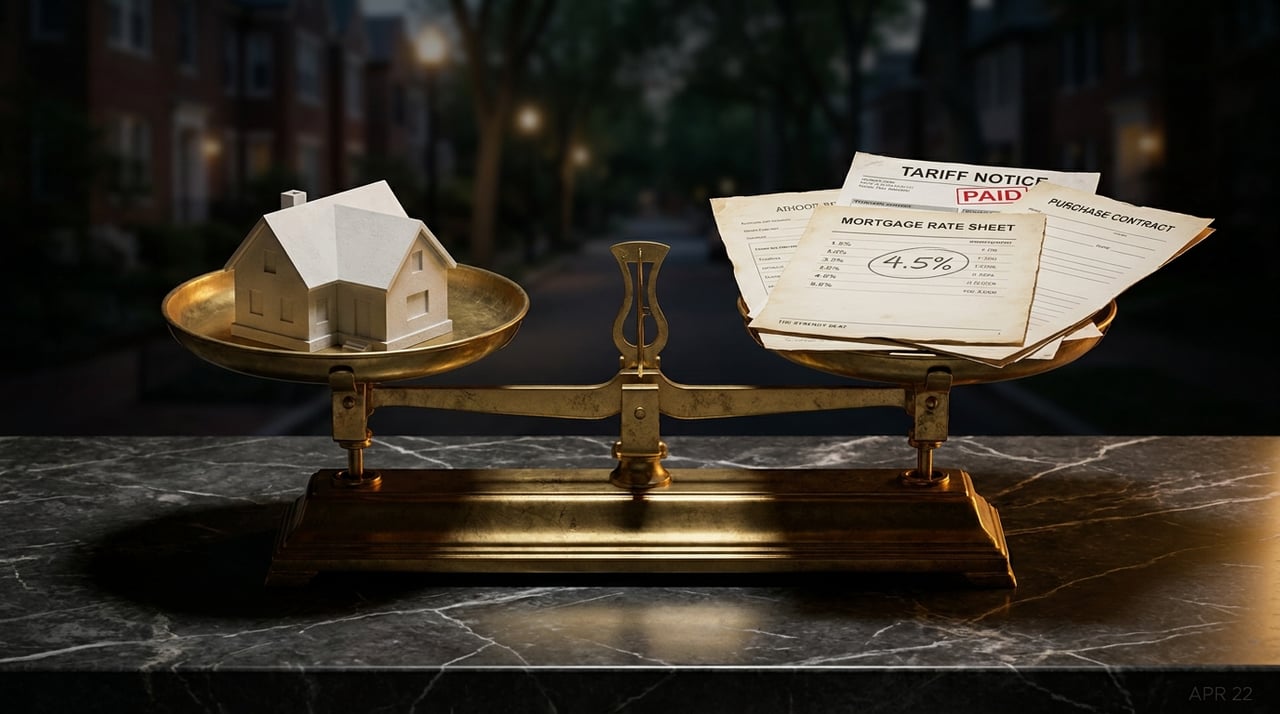
Everyone is talking about the 50-year mortgage because it promises one thing:
lower monthly payments.
But monthly payment is not the same as affordability, and it is not the same as good capital allocation.
This breakdown compares a 30-year mortgage and a 50-year mortgage using the same property, realistic rates, and a standard holding period, and then evaluates whether the commonly suggested strategy of “investing the monthly savings” actually works.
Base Scenario Assumptions
To keep the analysis grounded, we use a single, realistic purchase scenario.
| Assumption | Value |
|---|---|
| Purchase Price | $900,000 |
| Down Payment | 20% |
| Loan Amount | $720,000 |
| Expected Holding Period | 7–10 years |
| Property Appreciation (assumed) | 4% annually |
Loan Structures Compared
Longer loan terms carry more rate risk. The interest rates used reflect a realistic spread between products.
| Loan Type | Term | Months | Interest Rate |
|---|---|---|---|
| 30-Year Fixed | 30 years | 360 | 6.5% |
| 50-Year Fixed | 50 years | 600 | 7.0% |
Monthly Payment Comparison (Principal & Interest Only)
Taxes and insurance are excluded so we can isolate amortization behavior.
| Loan Type | Monthly Payment |
|---|---|
| 30-Year Mortgage | $4,550 |
| 50-Year Mortgage | $4,260 |
| Difference | $290 / month |
Observation:
The 50-year mortgage reduces the monthly payment by approximately 6.3%.
This is the core appeal — and also where the analysis often stops.
Total Cost Over the Full Loan Term
Lower payments do not mean lower cost.
| Loan Type | Total Payments | Total Interest Paid |
|---|---|---|
| 30-Year Mortgage | ~$1,637,880 | ~$917,880 |
| 50-Year Mortgage | ~$2,555,940 | ~$1,835,940 |
Key takeaway:
The 50-year mortgage costs approximately $918,000 more in interest over its life.
Amortization Reality: When Does Principal Overtake Interest?
This is one of the most overlooked metrics in mortgage discussions.
| Loan Type | Principal > Interest |
|---|---|
| 30-Year Mortgage | ~18.1 years |
| 50-Year Mortgage | ~32.4 years |
Interpretation:
With a 50-year mortgage, meaningful principal reduction is delayed by more than 14 additional years.
Amortization Snapshot: After 10 Years
This matters because most homeowners do not hold a property for 30 or 50 years.
Remaining Loan Balance
| Loan Type | Balance After 10 Years |
|---|---|
| 30-Year Mortgage | ~$572,000 |
| 50-Year Mortgage | ~$681,000 |
| Difference | $109,000 |
Principal Paid vs. Interest Paid (10 Years)
| Metric | 30-Year | 50-Year |
|---|---|---|
| Principal Paid | ~$148,000 | ~$39,000 |
| Interest Paid | ~$397,000 | ~$472,000 |
Reality check:
After 10 years, the 50-year borrower has paid down only ~5% of the original loan.
What Happens If Home Prices Decline?
If a property declines by 5% in value over a 10-year period:
-
A 30-year borrower still has meaningful equity
-
A 50-year borrower may have no usable equity at all
-
Transaction costs would likely erase remaining gains
This is where slow amortization becomes a risk, not just a trade-off.
The “Invest the Monthly Savings” Argument
A common defense of the 50-year mortgage is:
“Take the $290/month savings and invest it.”
Let’s test that with reasonable assumptions.
Investment Assumptions
| Parameter | Value |
|---|---|
| Monthly Contribution | $290 |
| Investment Period | 10 years |
| Annual Return (assumed) | 8% |
| Total Contributions | $34,800 |
Investment Outcome
| Metric | Value |
|---|---|
| Future Value (10 yrs) | ~$52,500 |
Total Equity After 10 Years (Including Investment)
Assuming 4% annual home appreciation:
| Metric | 30-Year Mortgage | 50-Year Mortgage |
|---|---|---|
| Property Value (Year 10) | ~$1,332,000 | ~$1,332,000 |
| Remaining Loan Balance | ~$572,000 | ~$681,000 |
| Home Equity | ~$760,000 | ~$651,000 |
| Investment Offset | — | +$52,500 |
| Net Position | $760,000 | ~$703,500 |
Result:
Even after investing the monthly savings at 8%, the 50-year borrower is still nearly $60,000 behind after 10 years.
Bottom Line: Why the 50-Year Mortgage Fails
The 50-year mortgage:
-
Slightly lowers monthly payments
-
Dramatically increases total interest
-
Delays equity accumulation for decades
-
Exposes borrowers to downside risk
-
Behaves like interest-heavy debt for most holding periods
For homeowners and investors alike, amortization speed matters.
A mortgage is not just a payment — it is a capital structure decision
Final Thought
If a financial product only works when everything goes right — appreciation, returns, timing — it isn’t conservative leverage. It’s speculation.
Before choosing a longer loan term, understand what you gain, what you give up, and how time actually works against you.